Concept dictionary
Process Map
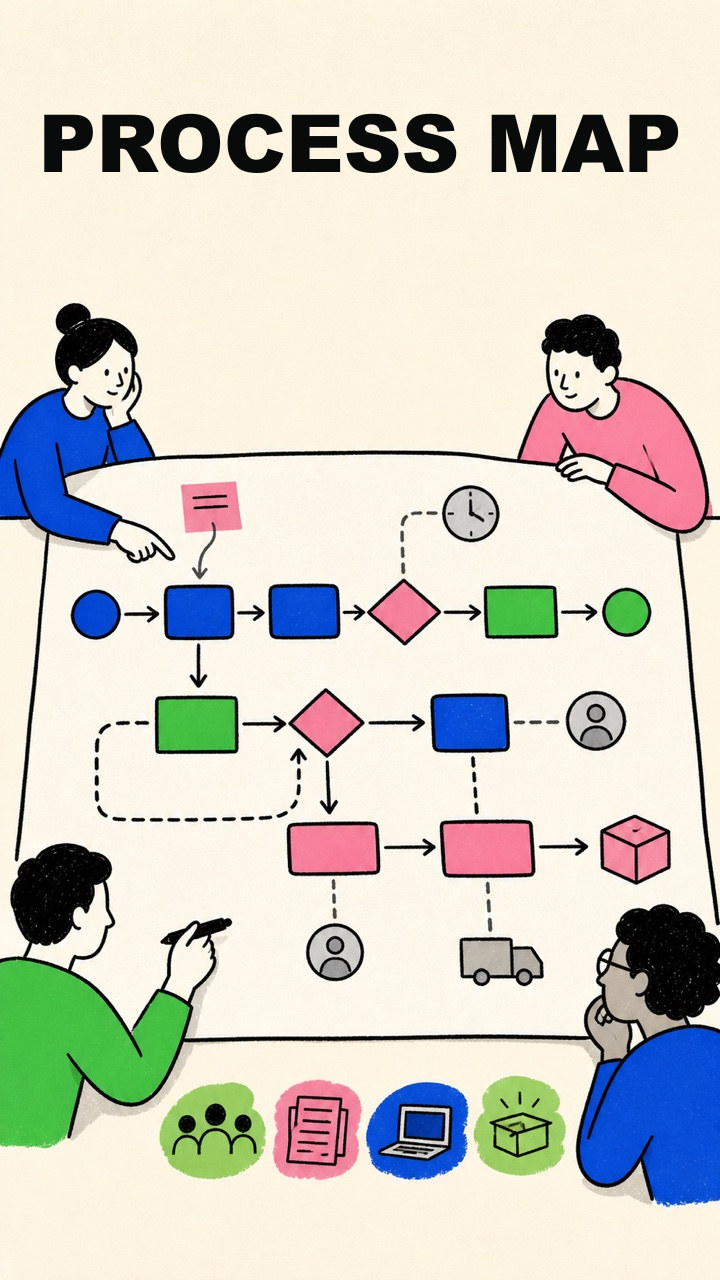
A process map is a visual representation of how work moves through a process. It can show steps, decisions, handoffs, actors, inputs, outputs, delays, and the relationships among them.
- Review state
- Reviewed in POC
- Freshness
- Current
- Version
- 1
Also called
- process-map
Remember it this wayPut the work on the page so the team can see it together.
In plain language
It puts the work on a page so people can see what happens, in what order, and who or what is involved. A simple flowchart is one common kind of process map.
Why it matters
Teams often describe the same process differently. Mapping the current work creates a shared object that can reveal hidden steps, unclear ownership, bottlenecks, rework, and differences between the documented process and actual practice.
Example
A team maps a service request from intake through triage, approval, assignment, completion, and follow-up. The map shows that requests wait twice for the same approval and that no role owns the final customer update.
Common misconception
A process map is not automatically the official, ideal, or complete process. It represents a chosen scope and level of detail. A useful map should say whether it depicts current practice, a proposed future state, or both.
Related terms
Sources
- American Society for Quality, “Flowchart”process maps as visual representations of steps, decisions, inputs, outputs, people, time, and measures.
- American Society for Quality, “Process Analysis Tools”process visualization as a tool for understanding and improving work.