Commentary / June 13, 2026
When a Doodle Becomes a Map
A reflection on how a quiet cocktail diagram became a reminder that robustness starts with seeing hidden relationships.
It is happy hour somewhere, and your mixologist knows a thing or two about systems thinking.
My friend Tim, a mixologist at Bitter & Sweet Cocktails, sent me a screenshot of what I at first thought was a clever doodle from The Bartender’s Manifesto. I was halfway to giving Tim a thumbs-up and going back to putting the dishes away when something in the image stopped me, but I did not know what.
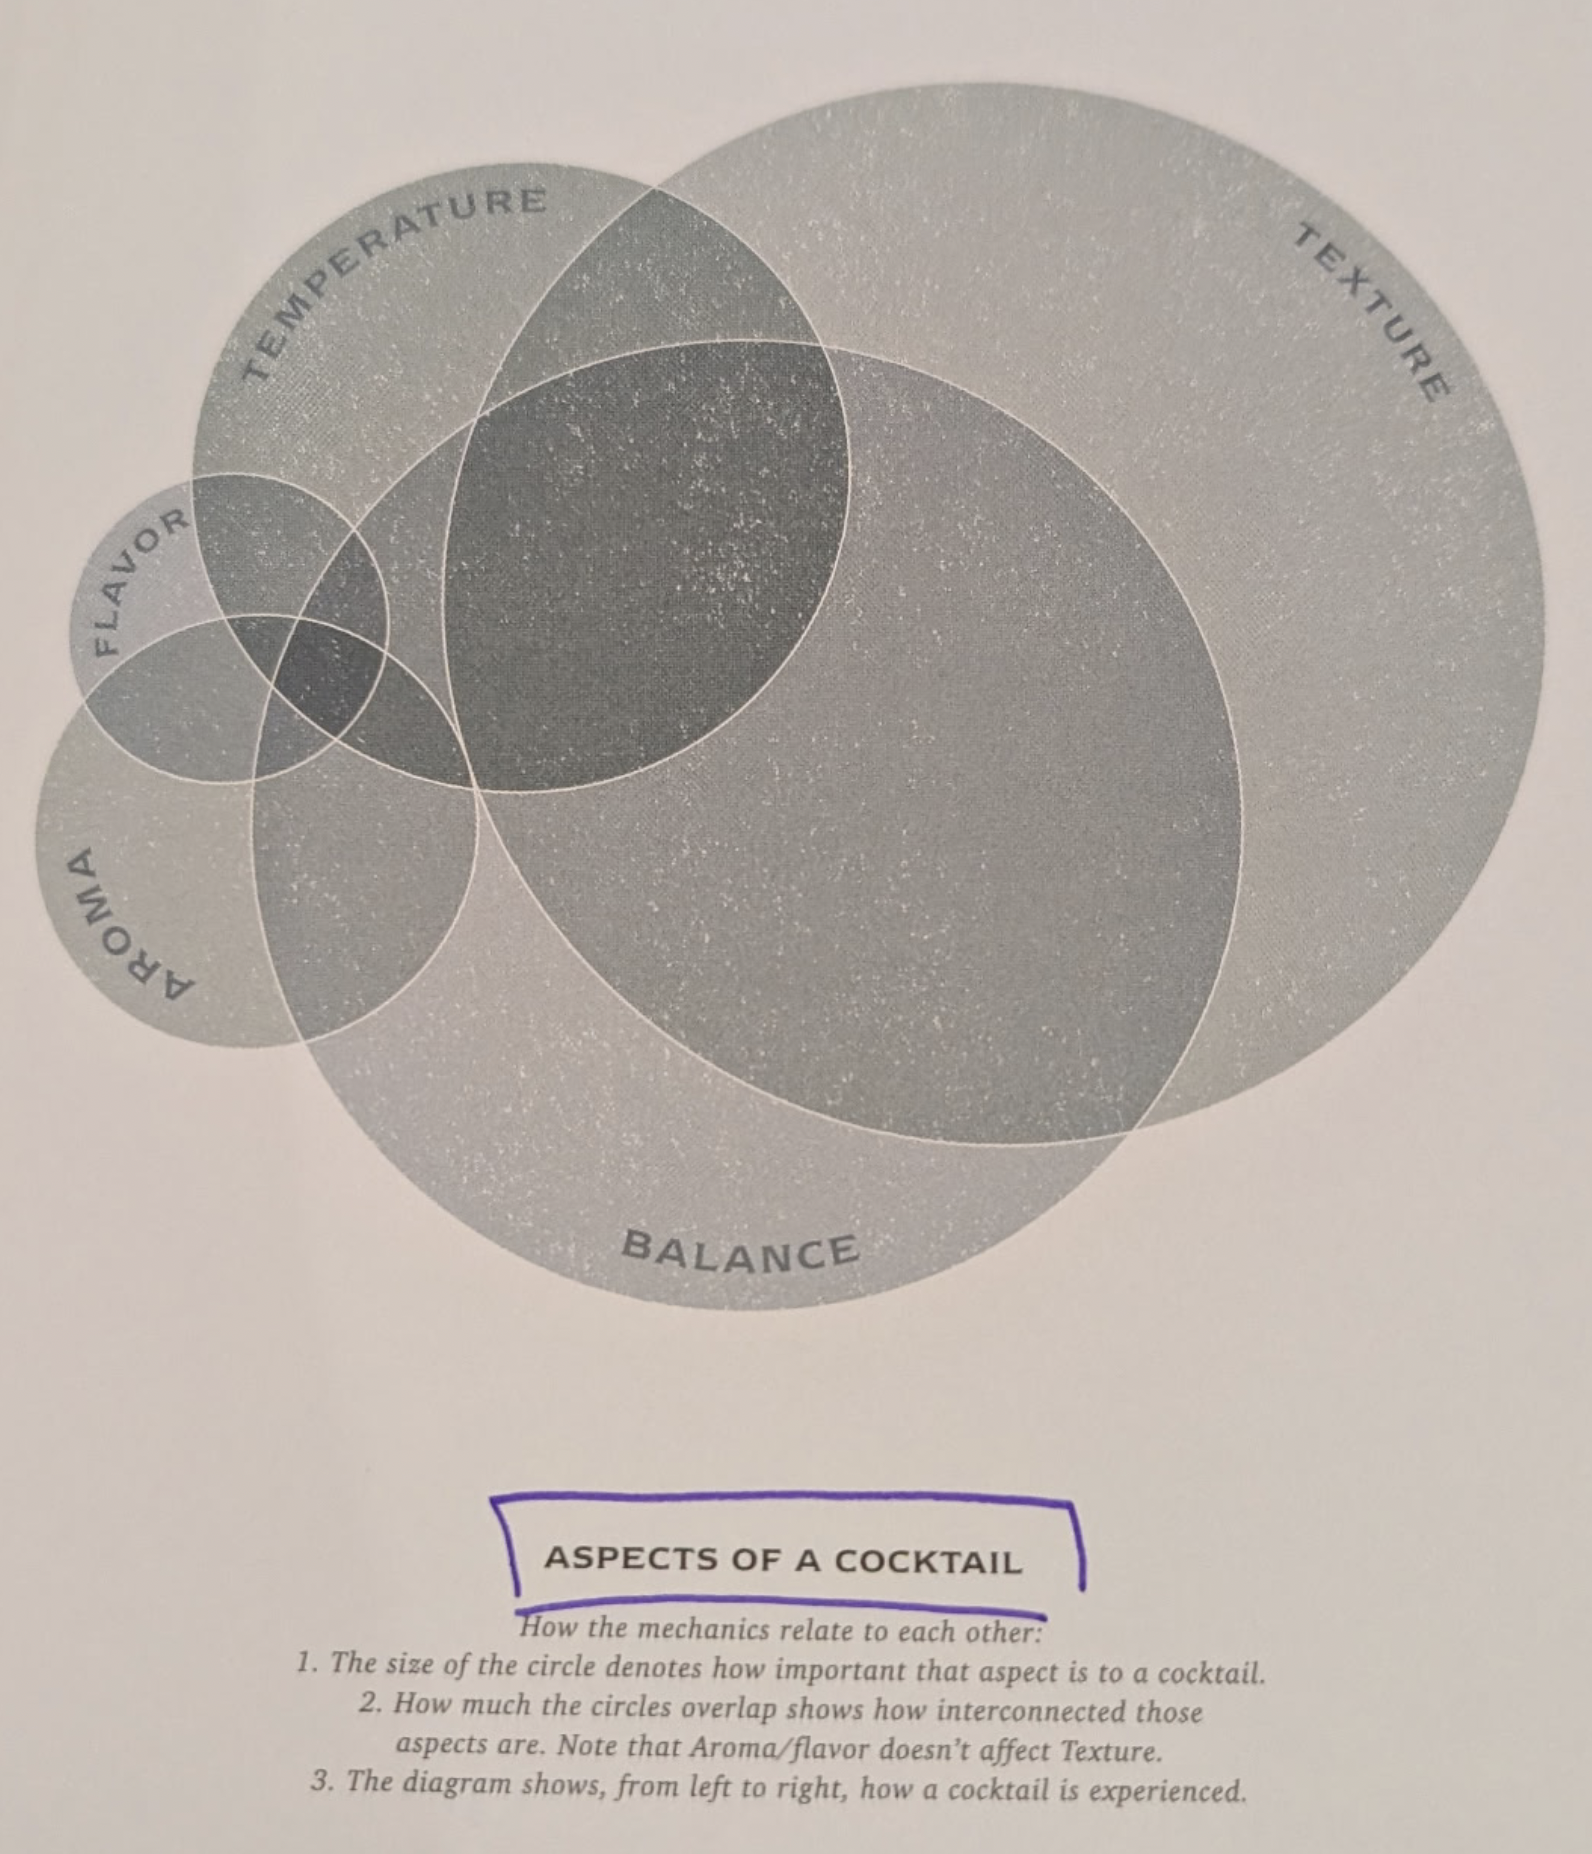
This was a simple image (not a meme) from a friend. The image, at first glance, was a bit blah. There were no arrows shouting for attention. No neon labels. No decorative clutter pretending to be insight. Just a dense little visual structure carrying more work than it appeared to be carrying.
And that reminded me of Edward Tufte, or at least of what I learned from him: good visualizations often do not win by becoming louder. They win by removing distractions until the relationships have nowhere left to hide.
So I stopped treating the image like a doodle and jumped into a rabbit hole for a couple of hours (thanks Tim).
A Good Diagram Teaches Us How to See
Good diagrams surface more than the facts. They expose relationships, constraints, interactions, nth order effects, and much more.
That may sound obvious, but most of us (me included) were trained to look at diagrams as containers. They hold facts. They organize categories. They provide a shortcut.
But the best diagrams change the question. Instead of asking, “What is listed here?” we start asking, “What is connected?” Instead of asking, “Which box does this belong in?” we start asking, “What dimensions are being used to place it there?”
The screenshot Tim sent was a Venn diagram of the various dimensions of cocktails. At a glance, it looked like circles and labels. But the longer I looked, the more it became clear that the circles were not decoration. The overlaps were not empty geometry. The placement of each label was not just a design choice.
This diagram encoded relationships.
It demonstrates how the cocktail experience lives in more than one moment or phase of taking a drink. The crafting of a cocktail is an engineering exercise designed for someone to experience. Some drinks sit cleanly inside a family. Others belong to the overlap between families. Some are not interesting because they are pure examples of a category, but because they are hybrids. They carry traits from multiple traditions, techniques, ingredients, or drinking experiences.
The diagram educates us on five different aspects, or dimensions, of something that most of us take for granted. Fortunately, we can count on our mixologists to deliver.
The Beauty and Risk of Quiet Design
This is where I have always had a small argument with the stricter Tufte purists.
I love the gold standard: high information density, low clutter, minimal distraction. A great visualization should not need confetti to prove it has something to say. But there is a difference between removing clutter and removing the reader’s way in.
Some people will marvel at a dense, elegant diagram. Others will bounce off it because they do not have the time, patience, training, or context to noodle through it in the dark. That does not make them lazy. It means the designer has made a choice about who gets invited into the meaning.
For creators, especially educational creators, the challenge is balance. We should not flatten complexity until the interesting parts disappear. But we also should not make people earn comprehension through unnecessary obscurity.
The sweet spot is not simplicity for its own sake. It is guided density: enough structure to preserve the complexity, enough invitation to help the reader begin.
That is what almost failed for me. The diagram was elegant enough to be ignored.
If I had never learned anything about visualization, I might have sent Tim a thumbs-up and moved on and missed out on this rabbit hole.
Cocktails Are Already Dimensional
A cocktail is not experienced as a recipe.
It starts before the first sip. The glass has weight. The temperature reaches your hand. The surface catches light. There may be citrus oil in the air, smoke, herbs, bitterness, sugar, spice, or the clean bite of alcohol rising before the drink ever touches your mouth.
Then comes texture: sharp, silky, fizzy, dense, thin, creamy, bracing.
The first sip lands somewhere between aroma, temperature, sweetness, acidity, bitterness, dilution, and burn. A good drink does not succeed because one of those dimensions wins. It succeeds because they negotiate.
That is why the diagram matters. A cocktail is already a multidimensional experience. The Venn diagram does not invent that complexity. It gives us a way to see it.
Reading the Space Between the Circles
A Venn diagram looks simple because the shapes are familiar. Circles overlap. Labels go inside. We learned the grammar early (4th grade for me).
But familiar shapes can hide system details.
In this case, each circle represents a dimension of cocktail identity. A drink may belong strongly to one circle, but the interesting work happens where the circles overlap. The overlap tells us that the drink cannot be fully understood through one lens.
That matters because we often want categories to behave like containers:
- This drink is this kind of thing.
- This system is this kind of system.
- This problem belongs to this department.
- This risk is technical.
- This failure is human.
- This opportunity is operational.
But real systems rarely stay inside clean boundaries. They leak across them. They belong to multiple categories at once. They live in the overlap.
That is where the diagram reminds us that classification is not the same thing as understanding. Robustness depends on noticing the overlaps before they surprise us.
From Recipes to Relationships
A recipe (or instructions and flowcharts) tells us what to do. A diagram like this helps us understand why a thing feels the way it feels. If we only look at ingredients, we may know what went into the glass. But if we look dimensionally, we can begin to understand the experience the drink is trying to create.
- Sweetness is not just sweetness. It interacts with acid.
- Bitterness is not just bitterness. It changes depending on dilution, temperature, aroma, and context.
- Spirit-forward does not mean harsh.
- Refreshing does not mean simple.
A drink can be bright and serious, bitter and playful, delicate and dangerous. The same is true in systems work.
Processes are shaped by incentives, tooling, memory, trust, timing, handoffs, language, and accumulated scar tissue.
Data models carry business assumptions, historical compromises, hidden filters, naming conventions, and the ghosts of decisions nobody remembers making.
AI systems are shaped by training data, interface design, user behavior, governance, automation, uncertainty, feedback loops, and institutional appetite for risk.
When we think dimensionally, we stop asking only “What is this?” and start asking better questions like “What forces are shaping this?”
The Direction This Points
Familiar things can surface new insights when we change the dimensions we use to inspect them.
That is the part I keep coming back to as I get ready for my next chapter.
The work may depend less on having one grand answer and more on building better ways to see the shape of the question. Sometimes that will mean diagrams. Sometimes it will mean data models, workflows, conversations, prototypes, or small tools that help people notice what was already there but poorly lit.
The goal is not to make complexity disappear. The goal is to make complexity navigable and manageable.
That is what the cocktail diagram did for me. It took something sensory, social, historical, technical, and personal, then gave me a way to look at the relationships inside it.
I almost missed it because it was quiet. But once I slowed down, the doodle became a map.